ShortCircuit: The Week Everything Broke
In which we abandon two overlay networks, teach a VPS named ShortCircuit to be a brain, restore a three-node etcd quorum for the first time, and then watch every single service go dark anyway.
There’s a DigitalOcean VPS in San Francisco called shortcircuit-lighthouse-sfo3. I named it that because it was going to be a Nebula lighthouse — a simple relay node for a mesh overlay. The kind of thing you deploy in twenty minutes and forget about.
Instead, it became the nerve center of a week-long network transplant that took down every service, broke DNS, corrupted storage webhooks, orphaned load balancers, and taught me that migrating an overlay network under a running Kubernetes cluster is approximately as safe as rewiring a building’s electrical system while the tenants are showering.
ShortCircuit. The name turned out to be prophetic.
Act 1: The Case Against Nebula
If you’ve been following this saga, you know the history. The Zombie Apocalypse got the cluster running on Tailscale. The 47 Terabyte Exorcism gave it block storage. The Restraining Order divorced Tailscale from the data path and deployed Nebula as the primary overlay.
That last one was supposed to be the happy ending. It was not.
Ninety hours. That’s how long I spent stabilizing Nebula across three residential and one business sites. Ninety hours of packet captures, relay chain debugging, MTU gymnastics, and one incident where setting the MTU to 1200 took down SSH on every node simultaneously (turns out SSH packets are bigger than 1200 bytes — a fact I now know with the bone-deep certainty of someone who has locked themselves out of twenty machines at once).
The root cause was architectural: Nebula was designed for datacenters talking to datacenters. Static IPs, predictable NAT, direct UDP paths. My cluster is four houses on consumer ISPs behind double-NAT residential gateways, where the public IP changes every time the router reboots and the ISP’s CGNAT does things to UDP that would be illegal in most jurisdictions.
The relay chains were the real killer. Nebula’s relay model is a daisy chain — traffic hops through lighthouse nodes, and if a lighthouse hiccups, every connection routing through it dies simultaneously. When you’re running etcd over those relay paths, “hiccup” translates to “leader election cascade.”
How bad was it? I measured: 821 milliseconds average RTT between control planes. 118 leader flaps in 30 seconds. etcd’s default election timeout is 10 seconds. We were electing new leaders faster than the old leaders could finish their acceptance speeches.
Multi-node etcd was fatally unstable. I was forced to run a single-node etcd cluster — one control plane, no fault tolerance, no redundancy. The genesis node in Torrance was the single point of failure for the entire eighteen-node fleet. If that Framework Desktop crashed, the cluster was dead.
The Original Sin
Here’s the irony: the reason I left commercial Tailscale in the first place was CPU usage. tailscaled was consuming 91% of a Raspberry Pi 4’s CPU. But the actual cause wasn’t Tailscale being greedy — it was DRBD replication traffic being WireGuard-encrypted on ARM CPUs.
DRBD synchronizes block storage at the kernel level. Every write to a replicated volume generates a packet storm. Those packets were hitting the Tailscale interface, getting encrypted by WireGuard in userspace, and the poor RPi4’s Cortex-A72 was melting trying to keep up with AES-256-GCM at wire speed.
The fix was trivially simple: use LAN IPs for DRBD replication between same-region nodes. The packets never need to leave the local network. I’d already partially implemented this before the Nebula migration, which means the entire Nebula detour — the ninety hours, the relay chains, the single-node etcd — was solving a problem that had a five-minute fix.
Systems engineering is a humbling profession.
Act 2: ShortCircuit Becomes a Brain
The plan was simple in the way that plans are always simple before you execute them: deploy Headscale, the open-source Tailscale control server, on the SFO3 VPS. Get all the benefits of WireGuard mesh networking without paying for Tailscale’s control plane, without Nebula’s relay fragility, and with a DERP relay topology we actually control.
Headscale gives you the Tailscale protocol (WireGuard key exchange, NAT traversal, DERP relay) running on your own infrastructure. Same client-side tailscale binary, same kernel-level WireGuard, but the coordination server is yours.
The Server
ShortCircuit got a new job. Headscale v0.67.0, listening on 443, with an embedded DERP relay (region 900, code “sfo3”). A second DERP relay on the Austin Mac Mini (region 901, code “aus”) gives the eight Austin nodes a local relay instead of routing through San Francisco.
1
2
3
4
5
6
hs.kub0.io → ShortCircuit (SFO3)
  ├── DERP relay (embedded, region 900)
  └── Control plane (Headscale)

derp-aus.kub0.io → Aero (Austin Mac Mini)
  └── DERP relay (standalone, region 901)
No public Tailscale DERP servers. Every relay node is ours. The Tailscale public relays are there as a fallback, but in practice, every connection goes direct WireGuard or through our own DERP.
The Enrollment
Twenty-plus nodes to enroll. The procedure for each:
- Stop
tailscaled - Nuke the Tailscale state (this is a one-way door — the node forgets its commercial Tailscale identity)
- Point the login server at
hs.kub0.io - Start
tailscaled, authenticate with a pre-auth key - Verify the
tailscale0interface comes up with a new IP in the100.67.0.0/10range
Workers first, DNS infrastructure second, ADS-B feeders third, control plane dead last. Serial execution, one node at a time, because parallel enrollment of nodes that are currently carrying production traffic is the kind of decision that ends careers.
The Migration
With every node on Headscale, the real surgery began. Each of the fifteen active K3s nodes needed its flannel interface swapped from nebula0 to tailscale0, its --node-ip changed from a Nebula IP to a Headscale IP, and its K3s service restarted.
The procedure, per node:
1
2
3
4
5
6
kubectl drain <node> --ignore-daemonsets --delete-emptydir-data
  # Edit k3s service: --flannel-iface=tailscale0, --node-ip=<new_ip>
systemctl daemon-reload && systemctl restart k3s-agent
  # Wait for Ready...
kubectl uncordon <node>
kubectl annotate node <node> flannel.alpha.coreos.com/public-ip=<new_ip> --overwrite
That last step — the flannel annotation — is critical. Flannel doesn’t self-heal its public IP annotation when --node-ip changes. If you skip it, flannel thinks the node is still at the old IP and routes VXLAN traffic into the void. I learned this the fun way: three nodes were Ready but couldn’t reach any pods on other nodes, and the only symptom was “connection timed out” with no useful error message anywhere.
The control plane migration was the most delicate part. The genesis node — the one running etcd, the API server, the scheduler — had to be migrated last. And because K3s agents panic when the API server disappears, the procedure was:
- Stop all fifteen agents simultaneously
- Migrate the control plane
- Wait for
flannel.1to come up on the new interface - Restart agents one at a time, thirty-second gaps between each
Thirty seconds doesn’t sound like much. Multiply it by fifteen nodes and you’ve got seven and a half minutes of watching progress bars while mentally calculating the probability that the next restart will be the one that doesn’t come back.
They all came back.
The Quorum
And then, for the first time since the cluster’s inception, I did something that had been impossible over Nebula: I restored a three-node etcd quorum.
Three control planes, all on Framework Desktop AMD machines with real CPUs and real RAM:
| Node | Region | RTT to Genesis |
|---|---|---|
| toa-fwd-gpu-01 | Torrance (genesis) | – |
| lax-fwd-gpu-01 | LA | <10ms |
| aus-fwd-gpu-01 | Austin | ~50ms |
Two of the three quorum members are in Southern California, less than 10 milliseconds apart. The third is in Austin, 50 milliseconds away. Even in a worst case, two of three members can reach each other in under 10ms. Compare that to Nebula’s 821ms relay-chain RTT.
etcd heartbeat interval: 500ms. Election timeout: 5000ms. The margins went from “cardiac arrest” to “light jog.”
For the first time, the genesis node is not a single point of failure. If Torrance loses power (which happens — Southern California Edison has opinions about infrastructure), LA picks up the election in under a second. The cluster survives.
Act 3: Everything Breaks
The migration was complete. Twenty nodes on Headscale, three-node etcd quorum humming, flannel VXLAN flowing over direct WireGuard tunnels. I leaned back. I exhaled.
Then I opened a browser and typed console.kub0.xyz.
Nothing. 502 Bad Gateway.
grafana.kub0.xyz. Nothing.
adsb.kub0.xyz. Nothing.
I ran kubectl get nodes. All Ready. kubectl get pods -A. All Running. The cluster was healthy. The cluster was perfect. The cluster was serving absolutely nothing to the outside world.
What followed was a twelve-hour debugging session that I can only describe as a cascading failure archaeology expedition, where each fix uncovered a deeper, more creative way for the system to be broken.
Layer 1: The GPU Taint Trap
K3s ships with klipper-lb, a lightweight service load balancer that runs DaemonSet pods on every node to claim external IPs. Except klipper-lb doesn’t tolerate GPU taints.
All six AMD GPU nodes have amd.com/gpu=true:NoSchedule. The klipper-lb pods couldn’t schedule on them. DNS was pointing at the control plane nodes (which are Framework machines), but no load balancer was running on those nodes.
Every external request hit a control plane IP, found no load balancer listening, and returned 502.
Fix: Add GPU taint tolerations to klipper-lb. Two lines of YAML, forty minutes of debugging.
Layer 2: The Traefik Betrayal
With the load balancer fixed, traffic was reaching Traefik. But every kub0.xyz service returned 404.
Traefik 3.6.9 ships with allowExternalNameServices: false by default. Half our services use ExternalName to route to endpoints outside the cluster. Traefik was receiving the requests, looking up the backend, seeing an ExternalName service, and politely refusing to proxy it.
Fix: --providers.kubernetesIngress.allowExternalNameServices=true in the Traefik Helm values. One flag.
Layer 3: The CRD Massacre
The Traefik Helm upgrade that fixed the ExternalName issue also wiped every CRD-based Middleware resource in the cluster. Every StripPrefix, every ForwardAuth, every CORS middleware — gone. Traefik references these middlewares by name in ingress annotations. Without them, every ingress that used networking-auth-internal@kubernetescrd or networking-strip-adsb@kubernetescrd returned 404.
I didn’t notice immediately because the 404s looked identical to the ExternalName 404s. Same status code, same empty response body. Two completely different failure modes wearing the same mask.
Fix: Re-apply every middleware manifest. kubectl apply -f manifests/portal/, kubectl apply -f manifests/adsb/, kubectl apply -f manifests/cctv/, kubectl apply -f manifests/cloudflare-tunnel/. Twenty minutes of kubectl apply and checking that nothing else had been silently deleted.
Layer 4: The Webhook Ghost
With services coming back online, I noticed LINSTOR storage was broken. Pods with PersistentVolumeClaims were stuck in Pending. The piraeus-operator was in CrashLoopBackOff.
The root cause: the piraeus-operator-gencert job’s ValidatingWebhookConfiguration had been lost during the migration. Kubernetes was trying to validate LINSTOR resources through a webhook that no longer existed, and failing closed — every LINSTOR operation was rejected.
Fix: Delete the stale ValidatingWebhookConfiguration, restart the piraeus-operator pod, let it regenerate.
Layer 5: The Phantom Endpoints
ADS-B endpoints — the three regional feeders that serve aircraft data — were returning 503. The services were ExternalName or headless services pointing at the feeder nodes. The Endpoints objects still had the old Nebula IPs.
This one was obvious in retrospect: headless services with manually-managed Endpoints don’t auto-update when the network layer changes. The Endpoints were pointing at 10.67.x.y addresses that no longer existed on the flannel network.
Fix: Update all Endpoint addresses to Headscale IPs in the manifests. Apply.
Layer 6: The Unnamed Port
This was the subtle one. One service was returning “no available server” from Traefik even though the Endpoints were correct and the pods were healthy. Traefik just… refused to proxy to it.
Forty-five minutes of staring at ingress annotations, service definitions, and Traefik debug logs before I found it: the headless service had an unnamed port in its Endpoints. Traefik requires port names in Endpoints to match the port name in the Service spec. An unnamed port is treated as a non-existent port.
1
2
3
4
5
6
7
8
9
10
# Broken:
ports:
  - port: 8080
    protocol: TCP

# Fixed:
ports:
  - name: http
    port: 8080
    protocol: TCP
Four characters. name: http. Forty-five minutes.
Layer 7: The Proxy Chain
The CCTV API scrapes traffic camera feeds from Austin and California. The California cameras are behind CalTrans infrastructure that blocks datacenter IPs, so the scraper routes through a Mullvad VPN proxy.
The Mullvad proxy configuration used commercial Tailscale IPs. Those IPs no longer existed. Every CalTrans scrape was timing out, and the CCTV API was reporting zero California cameras.
Fix: Update the proxy URLs with Headscale IPs.
Layer 8: The MTU Squeeze
The final layer. CalTrans API responses were intermittently failing even after the proxy fix. Large JSON payloads from the California DOT would start downloading and then stall.
Flannel MTU over Tailscale WireGuard: 1230 bytes. The CalTrans API sends chunked responses with large payloads. Some chunks exceeded the path MTU, got fragmented, and the fragments were being silently dropped by an intermediate NAT that doesn’t reassemble.
This one didn’t have a clean fix — it’s a property of the transport stack. The MTU is what it is. The workaround was adjusting the scraper’s HTTP client to request smaller chunks and set Accept-Encoding: gzip to reduce payload sizes below the fragmentation threshold.
Act 4: The Vital Signs
After twelve hours of debugging, re-applying manifests, and updating every hardcoded IP in the system, the cluster was back online. All of it. ADS-B feeds flowing, CCTV cameras scraping, Grafana dashboards rendering, OAuth2 Proxy authenticating.
But this time, something was different.
1
2
3
toa ↔ lax:   <10ms   (direct WireGuard, same metro)
toa ↔ aus:    ~50ms   (direct WireGuard, cross-country)
toa ↔ hnd:   ~150ms  (direct WireGuard, trans-Pacific)
All three paths are direct. No relays. No DERP. No daisy chains. WireGuard punches through the NAT on both sides and maintains a direct encrypted tunnel.
Compare to what we had before:
| Metric | Tailscale (commercial) | Nebula | Headscale |
|---|---|---|---|
| TOA↔HND RTT | 135-1020ms (relay-dependent) | 172-821ms (relay chain) | ~150ms (direct) |
| etcd stability | Frequent leader flaps | 118 flaps/30s | 0 flaps (8hr observation) |
| etcd quorum | Single-node (forced) | Single-node (forced) | 3-node HA |
| Relay dependency | 100% (DERP) | ~60% (lighthouse chain) | 0% (direct paths) |
| Control plane | Tailscale Inc. | Self-hosted (Nebula CA) | Self-hosted (Headscale) |
| CPU overhead (RPi4) | 91% (tailscaled + DRBD crypto) | ~15% (nebula) | ~8% (tailscaled, no DRBD on tunnel) |
The cluster has a heartbeat now. A real one — three control planes in quorum, heartbeating at 500ms intervals, with sub-50ms latency between any two of them. If Torrance goes dark, the election takes 5 seconds. If Austin goes dark, Torrance and LA still have quorum. The single point of failure that’s haunted this cluster since day one is gone.
Nebula stays running. nebula.service is still enabled on every node, the nebula0 interface still up, the certificates still valid. It’s the backup SSH path — the emergency exit when everything else fails. Because if I’ve learned anything from this week, it’s that “everything else fails” is not a theoretical scenario. It’s a Tuesday.
Act 5: The Matryoshka Revelation
A week after the migration, I ran tailscale status and stared at the output for a long time.
1
2
3
4
aus-ctrl-01    100.67.0.6   linux   active; direct 10.67.2.2:41641
aus-node-01    100.67.0.7   linux   active; direct 10.67.2.4:41641
lax-node-01    100.67.0.16   linux   active; direct 10.67.3.1:41641
hnd-fwd-gpu-01 100.67.0.17  linux   active; direct 10.67.4.5:41641
Those 10.67.x.x addresses in the “direct” column? Those are Nebula IPs. Not LAN IPs. Not public IPs. Nebula mesh IPs.
WireGuard was building its “direct” tunnels through Nebula. The Headscale control plane was negotiating peer endpoints, Tailscale was performing NAT traversal, and the path it found — the shortest, most reliable route between any two nodes — was the Nebula overlay sitting underneath.
Three layers of networking, stacked like Russian dolls:
1
2
3
4
5
6
7
8
9
10
11
12
┌─────────────────────────────────┐
│  Flannel VXLAN (pod traffic)    │  ← what K3s sees
│  on tailscale0, MTU 1230        │
├─────────────────────────────────┤
│  WireGuard / Headscale          │  ← what tailscale status shows
│  "direct" to 10.67.x.x:41641    │
├─────────────────────────────────┤
│  Nebula mesh overlay            │  ← the "deprecated" underlay
│  on nebula0, 10.67.0.0/16       │
├─────────────────────────────────┤
│  Physical LAN / WAN             │  ← actual copper and fiber
└─────────────────────────────────┘
I’d spent ninety hours cursing Nebula. I’d written an entire playbook to rip it out. I’d migrated every node off it. And here it was, quietly providing the direct paths that made Headscale work so well. The overlay I’d “replaced” was the substrate the replacement was running on.
It makes a perverse kind of sense. Nebula’s lighthouses had already punched NAT holes between every node pair. Those holes persist as long as nebula.service is running. When WireGuard goes looking for a direct path to another node, it tries every available interface — and nebula0, with its pre-punched NAT traversal and stable mesh IPs, is a better path than trying to punch through the ISP’s NAT from scratch.
Same-site nodes go even deeper. Within Austin, the Framework Desktops and Raspberry Pis are on the same subnet. Their Nebula connections route over LAN — the Nebula overlay just assigns consistent IPs to what’s already a direct Ethernet path. So for the Austin cluster, the stack is:
1
Flannel → WireGuard → Nebula → LAN → same switch
Four layers of encrypted encapsulation to talk to a machine three feet away. Each layer was added to solve the previous layer’s problems. Together, they form a networking stack that would make an OSI model diagram weep.
The really funny part? The RTT numbers barely changed. LAN adds microseconds. Nebula adds <1ms on LAN. WireGuard adds <1ms on Nebula. Flannel adds <1ms on WireGuard. Four layers of overlay, and the total overhead within a site is around 2 milliseconds. The speed of light between Austin and Tokyo still dominates everything — 150ms of physics that no amount of software layering can fix.
I could strip out Nebula. Force WireGuard to use raw LAN paths for same-site, raw WAN for cross-site. Shave maybe a millisecond off the local path. But that would mean giving up the emergency SSH path, the pre-punched NAT holes, and the one network layer that has never once gone down during a migration.
Sometimes the best architecture is the one you accidentally built by never finishing the demolition.
Act 6: The Toolkit
After the migration, after the twelve-hour debugging marathon, after discovering four layers of overlay stacked like a networking turducken — I was tired of typing ansible -m shell -a 'cat /proc/loadavg' all and then parsing raw JSON with my eyes.
The cluster had gotten complex enough that operating it required remembering which overlay was which, which nodes were control plane, which had GPU taints, which SSH key to use, and which of the three DNS servers to query. The kind of operational knowledge that lives in one person’s head and dies when that person goes to sleep.
So I built k0.
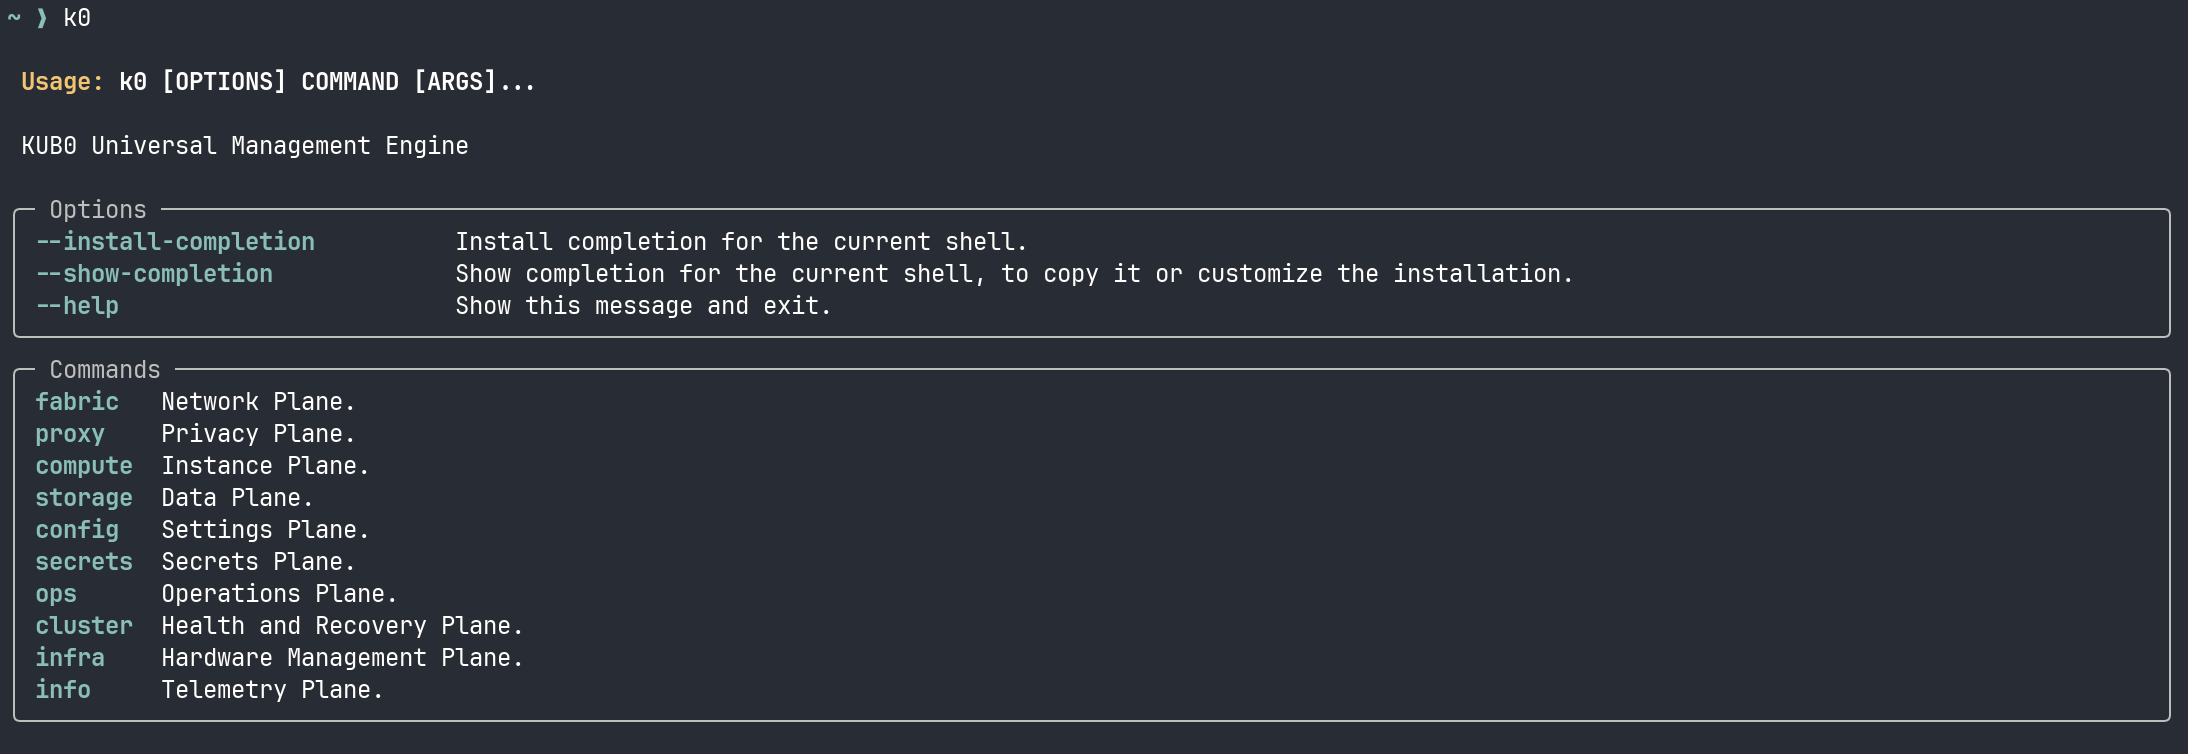
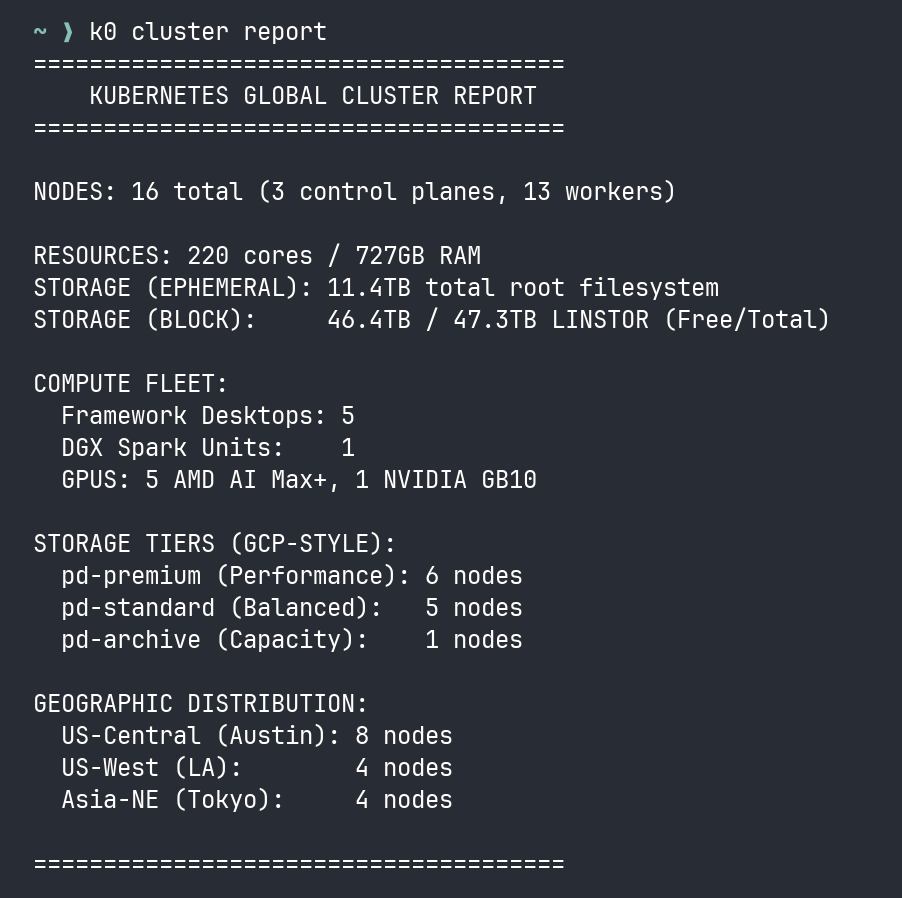
It’s a CLI that treats the cluster like a cloud platform. Not because it is a cloud platform — it’s twenty machines in four houses — but because the mental model works. Every operation maps to a plane: fabric for networking and mesh, compute for pods and instances, storage for block and object, config for settings, info for diagnostics, ops for maintenance playbooks.
The design came directly from this migration. During the Headscale enrollment, I needed to check mesh status, query node health, and manage SSH identities across three different overlay networks — all while draining and uncordoning Kubernetes nodes. That’s five different tools (tailscale, ansible, kubectl, ssh-add, headscale) with five different authentication models and five different output formats.
k0 wraps all of them behind one interface:
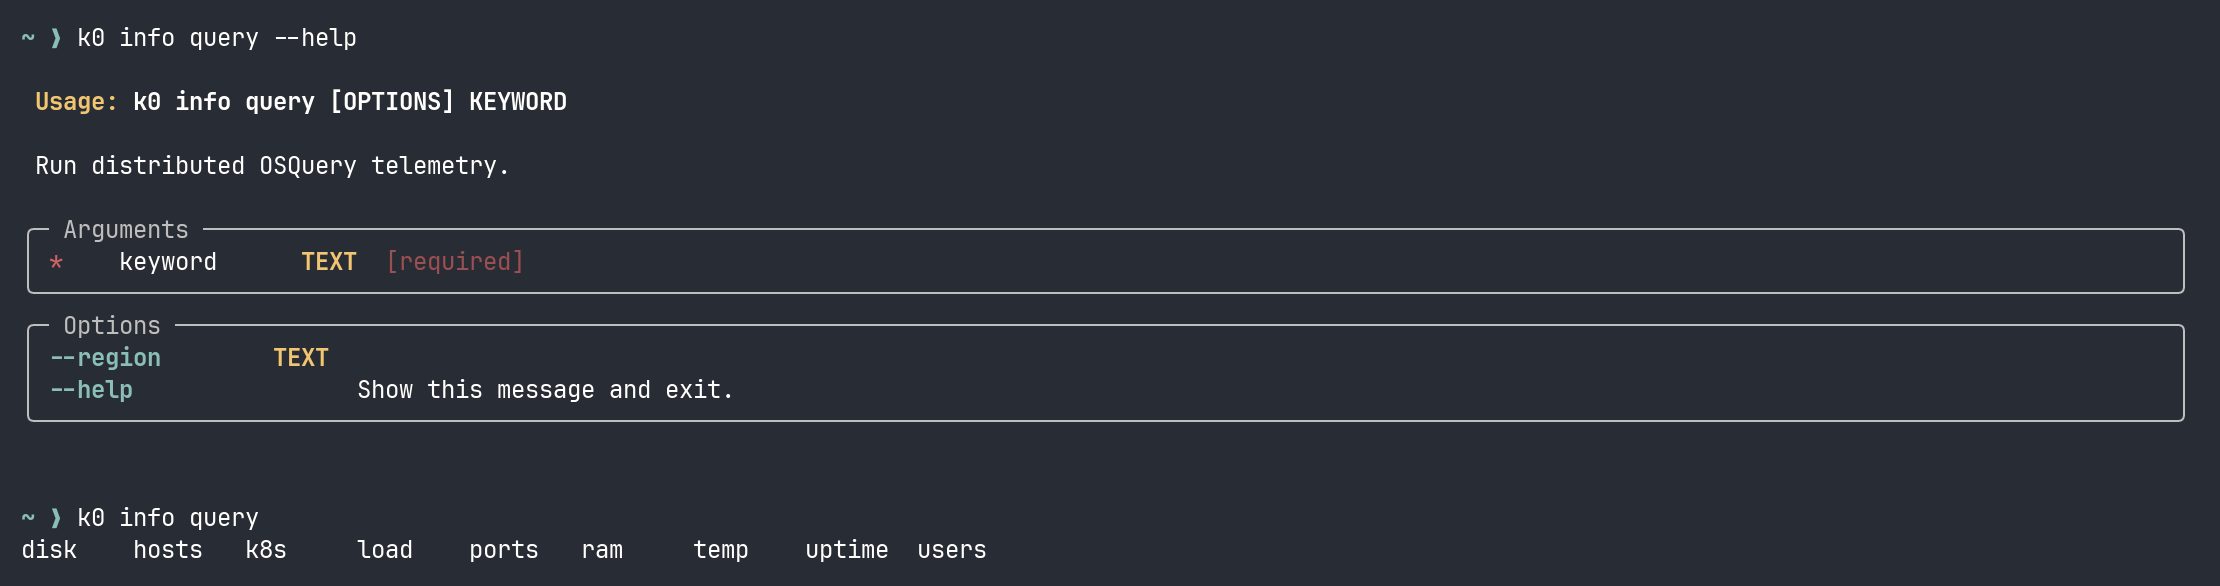
k0 info query load runs the load check across every node and returns a table. k0 fabric mesh list shows every Headscale peer with its IP and last-seen time. k0 config identity list shows which SSH keys are loaded — because when you’re managing nodes across four sites with different access paths, knowing which key is hot matters more than you’d think.
It’s not sophisticated. It’s a Python script with Typer and Rich that shells out to ansible and kubectl and parses JSON. But it turns a twenty-step diagnostic workflow into one command, and during a migration where every minute of downtime matters, that’s the difference between finding the problem and finding it too late.
The IaC tools — the playbooks, the manifests — are for building and rebuilding. The CLI is for operating. For the 2 AM check when something feels wrong and you need to know the state of every node in three seconds, not thirty.
The Naming
I named that VPS shortcircuit-lighthouse-sfo3 because it was supposed to be a simple Nebula lighthouse. A relay. A dumb pipe.
Instead, it became the control server for the entire mesh. The coordinator that replaced both a commercial SaaS product and a datacenter-oriented overlay network. The single binary running on a $6/month droplet that every node in the cluster authenticates against to join the network.
And the week I migrated to it, everything broke. Every service, every endpoint, every proxy chain, every middleware — all of it went dark and had to be rebuilt from the wreckage.
But here’s the thing about that wreckage: it was recoverable. Act 3 — the twelve-hour cascade of broken services — was painful, but every fix was a kubectl apply away. The middlewares were files. The endpoints were manifests. The proxy configs were checked into git. The breakage was catastrophic, but the state was versioned. You can rebuild a house from blueprints.
Act 2 — the actual migration — was different. Draining nodes, swapping --flannel-iface, restarting K3s, waiting for flannel.1 to come up on the right interface, hand-annotating flannel public IPs — that’s not declarative infrastructure. That’s plumbing. We wrote Ansible playbooks for it, and they worked, but a playbook for a network migration is a script for a human to supervise, not a desired state to converge on. If a manifest fails, you apply it again. If a network migration fails halfway, you have seven nodes on the new overlay and eight on the old one and nothing can talk to anything.
Everything above the network layer lives in git and can be rebuilt in an afternoon. Everything at or below it is surgery — one shot, no undo, the patient is awake. The manifests are the furniture; the overlay is the foundation. You can rearrange furniture after an earthquake. You cannot re-pour the foundation while people are living in the house.
Well. You can. I just proved that. But I don’t recommend it.
A short circuit, in electrical engineering, is when current bypasses the intended path and flows through an unintended one. It’s usually destructive. But sometimes, if you’re lucky, the unintended path turns out to be shorter, faster, and more reliable than the one you designed.
ShortCircuit. The VPS, the migration, and the lesson: sometimes you have to break everything to find out what’s actually load-bearing.
This is part of an ongoing series about building a 20-node K3s cluster across four countries on residential internet. Previous entry: The Restraining Order. The cluster lives. The alerts are quiet. For now.