The Dispatcher: Coordinating AI Agents at Cluster Scale
There’s a category of problem you don’t anticipate until you’ve already made it worse. You build a system that works. Then you scale it up. Then you discover that “works” and “works with multiple instances” are different theorems.
The nervous system metaphor I’ve been leaning on for this cluster has a corresponding failure mode: sensory conflict. Two signals arriving at the motor cortex simultaneously, both legitimate, both well-intentioned, both trying to move the same limb in different directions. Physiologically, this results in a tremor. In a Forgejo repository with multiple AI agents working the same issue queue, it results in something similar: competing PR branches, duplicate comments, label race conditions, and an elegant but useless tangle of partial work.
The fix is a dispatcher — a coordinator that serializes concurrent intent into sequential action.
The Problem It Solves
The altdata API was the first service built with what I’d loosely call “agentic scaffolding”: Claude Code sessions kicked off from JupyterLab, working through Forgejo issues one at a time, creating branches, opening PRs, iterating on feedback. It worked. One agent, one issue, one PR at a time.
The problem surfaces when you want to run multiple agents in parallel. Two agents look at the same queue. Both see issue #7 (“Add composite scoring”). Both start working. Agent A creates branch feature/issue-7-composite. Agent B also creates feature/issue-7-composite. One wins the push; the other hits a ref collision and does something sensible or something chaotic depending on its error handling.
Even without the exact same issue: if Agent A is refactoring the API layer and Agent B is also modifying the API layer on a different issue, their branches will conflict on merge even if they never touched the same file. You need scope-level conflict detection, not just issue-level exclusion.
The Orchestrator
The agent orchestrator is a small Go service — around 2,000 lines — that lives at agents.kub0.xyz (internal) and acts as registry and referee for all in-flight agent work.
The lifecycle:
- A Forgejo issue is opened with labels like
status:open,scope:api,complexity:feature - Forgejo fires a webhook to the orchestrator’s
/webhookendpoint - The orchestrator registers the task in its queue, persisted to a 1GB PVC as JSON
- An agent polls
/tasks, finds something it can work on, posts to/tasks/claim - The orchestrator checks scope conflicts: does any currently-claimed task in this repo share a
scope:*label with the candidate? If yes, reject — try a different task or wait - If clear, the orchestrator atomically swaps the label (
status:open→status:claimed), creates the working branch in Forgejo, posts a comment assigning the task, and returns the full task context to the agent - The agent works, posts progress via
/tasks/update, and on completion calls/tasks/completewith the PR URL - The orchestrator swaps to
status:in-review
Human merges the PR, closes the issue. The task transitions to done.
The scope conflict rule is the key primitive. scope:api means “changes to the HTTP layer and routing.” scope:logic means “core business logic and data models.” Two agents can simultaneously work scope:api in repo A and scope:logic in repo B. They cannot simultaneously work scope:api in the same repo — API changes tend to touch the same files, and concurrent branches produce merge conflicts that require human intervention, which defeats the purpose.
The Context Endpoint
One endpoint deserves mention: GET /context/{owner}/{repo}.
When an agent claims a task, it receives the task metadata. But it also needs the repo’s operating context: what conventions does this repo use? What’s the architecture? The orchestrator fetches CLAUDE.md and .claude/memory/MEMORY.md from Forgejo’s API and bundles them into the claim response. The agent starts work already oriented — conventions, architecture, known gotchas delivered before the first file read. What used to require exploratory reads at the top of every session now arrives pre-loaded.
This took about an hour to wire up and immediately made agent sessions noticeably less confused at the start of new tasks.
The Activity Log
The dashboard at agents.kub0.xyz shows a ring buffer of the last 100 lifecycle events: claims, releases, completions, conflicts, incoming webhooks. It polls three endpoints every five seconds — /tasks, /stats, /activity — and updates without a page refresh. Dark theme, monospace font, pulsing status dots. Same aesthetic as the rest of the cluster’s dashboards.
Five-second polling is a reasonable tradeoff for an internal tool. Server-sent events would be cleaner, but polling is simpler to debug and the orchestrator’s resource footprint is almost unmeasurable — 10m CPU requests, 32MB RAM.
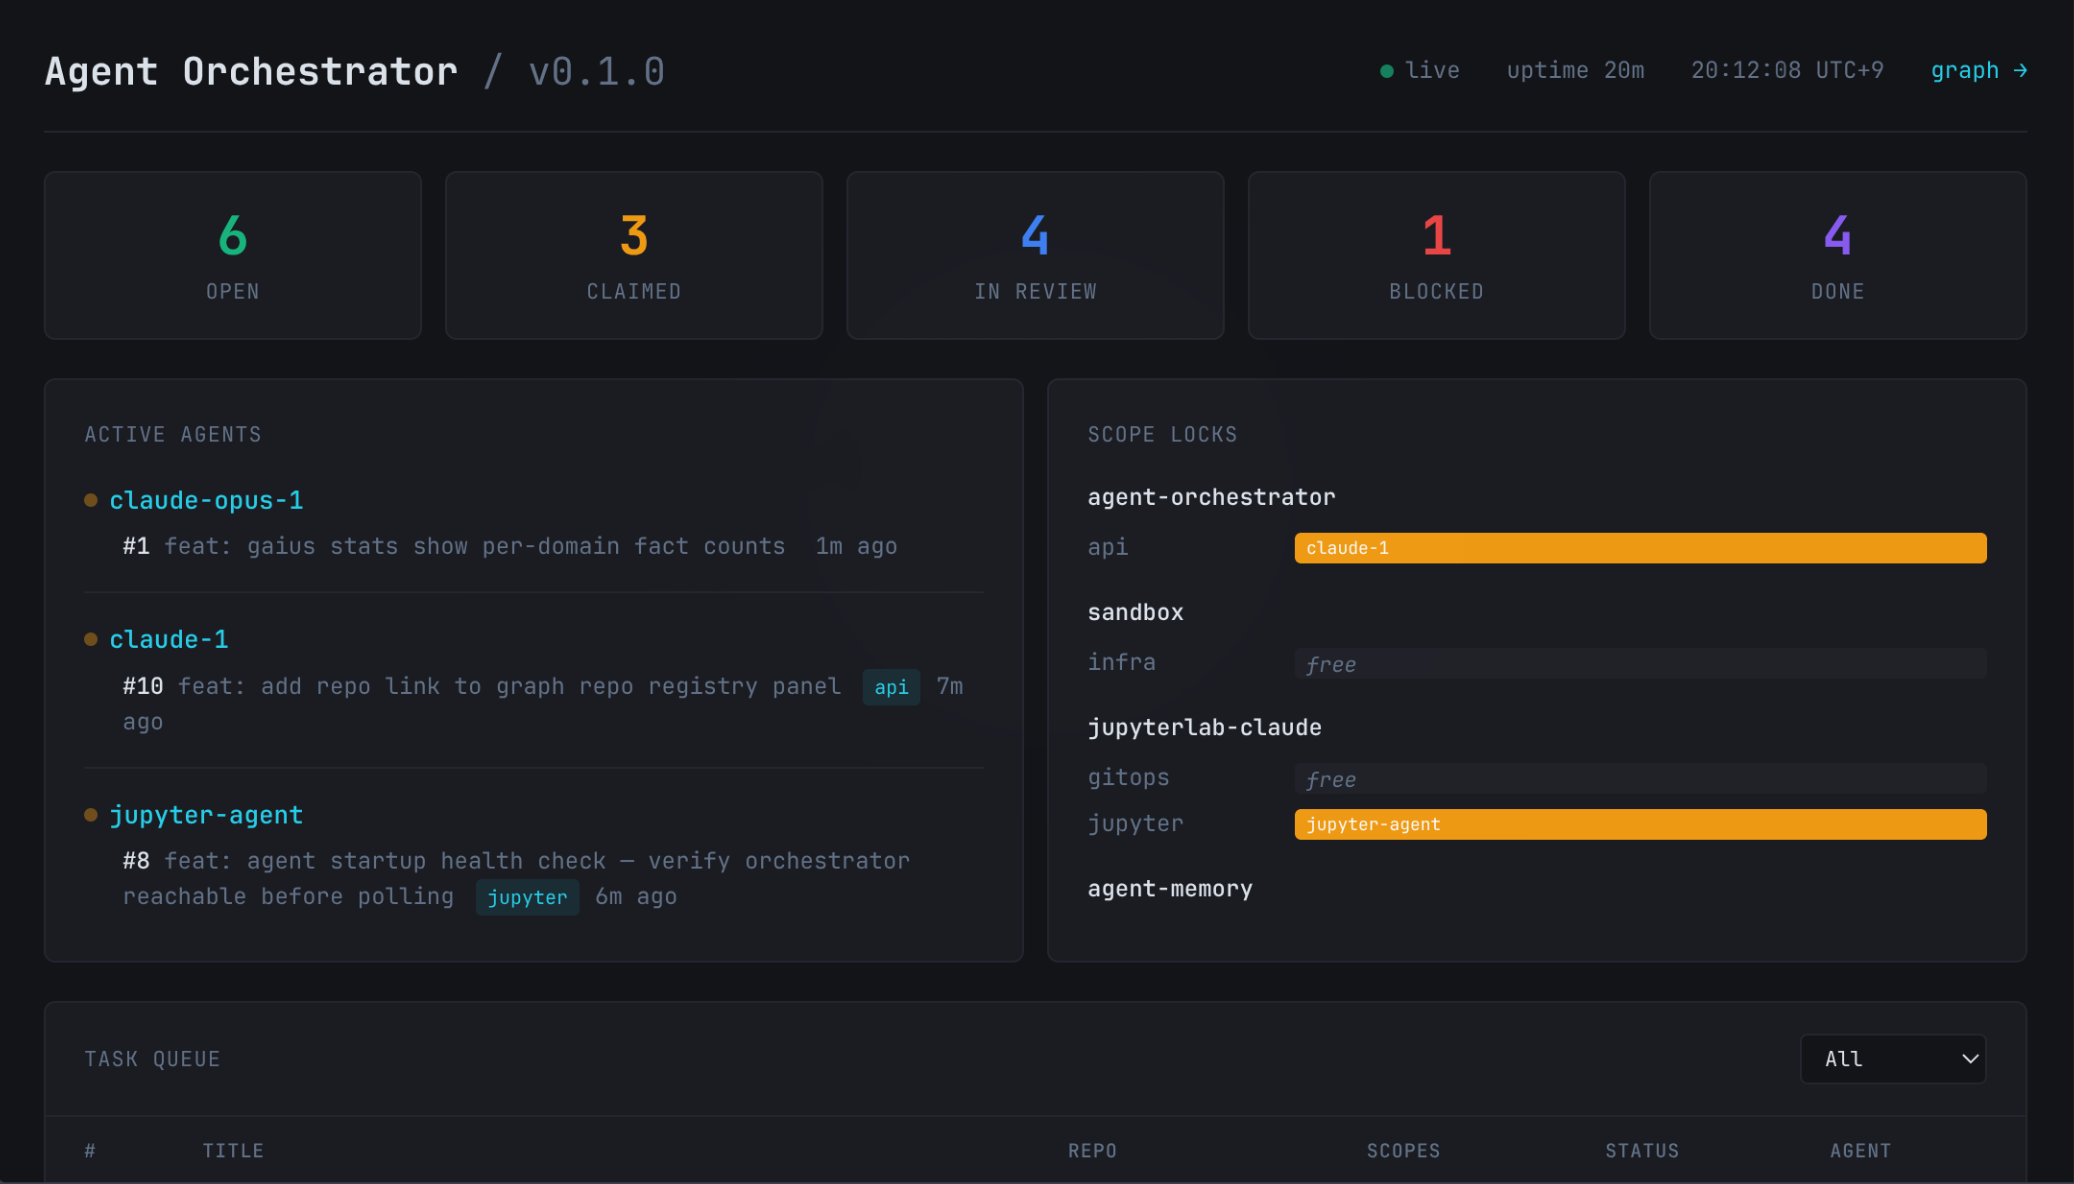 Agent Orchestrator v0.1.0 — three agents running simultaneously, scope locks engaged. 6 open, 3 claimed, 4 in-review.
The Forgejo Webhook Gotcha
The orchestrator receives events via Forgejo webhooks. You go to Forgejo → repo settings → webhooks, point it at http://agent-orchestrator.networking.svc.cluster.local:8080/webhook, save, fire a test ping. And get a timeout. Every time.
The logs on the orchestrator side are quiet. No connection arriving. The webhook fires but goes nowhere.
Forgejo has a setting called ALLOWED_HOST_LIST in the [webhook] section of app.ini. Its default value is external. This means Forgejo will only deliver webhooks to externally-routable IP addresses. Cluster-internal IPs — 10.42.0.0/16 and 10.43.0.0/16 — are private ranges, explicitly excluded.
Sensible default from a security perspective. In a private cluster where the orchestrator is the point, you need to allow it.
The lazy fix is to edit app.ini directly — kubectl exec into the pod, find the config file on the PVC, append the section by hand. It works. It’s also a configuration landmine: next upgrade potentially overwrites the PVC, or a pod restart reorders sections, or someone reading the StatefulSet manifest has no idea the real config lives elsewhere.
The right fix is the FORGEJO__section__KEY env var pattern. Forgejo supports configuration via environment variables using double underscores as section delimiters:
1
2
3
4
5
env:
  - name: FORGEJO__webhook__ALLOWED_HOST_LIST
    value: "10.42.0.0/16,10.43.0.0/16"
  - name: FORGEJO__webhook__DELIVER_TIMEOUT
    value: "30"
This goes in the StatefulSet spec alongside all the other env vars. Tracked in the manifest, visible to anyone reading the config, idempotent across restarts and upgrades. The PVC edit was removed, the env vars were added, Forgejo restarted cleanly, and the test ping landed in the orchestrator logs in under 200ms.
The lesson: always check whether a “configure at runtime” system supports env var injection before reaching for kubectl exec.
The Exposure Map
Once the orchestrator was running and handling tasks, the next capability felt obvious: the cluster should know what it’s exposed to the outside world.
This sounds abstract until you’re debugging a service that’s behaving differently internally versus externally and you need to check whether a tunnel route exists, whether DNS propagated, whether the CNAME is pointed correctly. That currently means: open Cloudflare dashboard, check DNS tab, switch to Tunnel tab, check ingress rules, open Technitium, compare. Every source is separate. Every check is manual.
The orchestrator now has a DNS/tunnel management layer that queries all three providers simultaneously and synthesizes a unified view:
GET /dns/records— all A records across Technitium (primary and secondary) and CloudflareGET /dns/status/{domain}— exposure state for a specific domainGET /tunnel/routes— Cloudflare Tunnel ingress rulesPOST /tunnel/routes— publish a new public hostname (tunnel route + CNAME atomically)DELETE /tunnel/routes/{hostname}— unpublishGET /services— everything combined: every DNS domain cross-referenced with tunnel routes, annotated with visibility
The visibility field is the useful one: internal (DNS only, no tunnel), public (tunnel route exists, internet-routable), or both (internal name plus a public tunnel route).
Running /services now returns entries like:
1
2
3
4
5
6
[
  {"domain": "home.kub0.xyz",    "visibility": "internal", ...},
  {"domain": "agents.kub0.xyz",  "visibility": "internal", ...},
  {"domain": "api.kub0.io",      "visibility": "public",   "tunnel_route": {...}, ...},
  {"domain": "console.kub0.io",  "visibility": "public",   "tunnel_route": {...}, ...}
]
POST /dns/records creates an internal hostname via Technitium; paired with POST /tunnel/routes, publishing a new service is two API calls. The practical target: an agent that just built a new service can check whether it needs to publish, and if so, do that through the orchestrator’s API without needing Cloudflare credentials directly.
The Build Took Twelve Hours and Then Thirteen Seconds
The orchestrator runs on arm64 — specifically on one of the RPi4 nodes via a nodeSelector on kubernetes.io/arch: arm64. The Dockerfile needs to produce an arm64 binary.
The naive cross-compilation approach:
1
2
3
FROM golang:alpine AS builder
ARG TARGETARCH
RUN GOOS=linux GOARCH=${TARGETARCH} go build ...
When you run docker buildx build --platform linux/arm64, buildx should inject TARGETARCH=arm64. It does — unless you declare the arg with a default:
1
ARG TARGETARCH=amd64  # ← this defeats buildx injection
With a default value present, buildx sees the arg is “already set” and doesn’t override it. You get TARGETARCH=amd64 regardless of the --platform flag. The build completes without error. The binary is amd64. The node is arm64. The pod starts, the kernel looks at the ELF header, and you get:
1
exec /orchestrator: exec format error
One-character fix (remove =amd64), but the default was there because it was cargo-culted from an earlier attempt. Three hours of debugging an error whose root cause fit in a tweet.
The complete working pattern:
1
2
3
4
5
6
7
8
9
10
11
12
13
14
15
16
17
# Builder always runs on the native host — Go cross-compiles without QEMU.
FROM --platform=$BUILDPLATFORM golang:1.25-alpine AS builder
# No defaults — buildx auto-injects the correct target values.
ARG TARGETOS
ARG TARGETARCH
WORKDIR /app
COPY go.mod go.sum ./
RUN go mod download
COPY . .
RUN CGO_ENABLED=0 GOOS=${TARGETOS} GOARCH=${TARGETARCH} \
    go build -ldflags="-s -w" -o /orchestrator ./cmd/orchestrator/

FROM scratch
COPY --from=builder /etc/ssl/certs/ca-certificates.crt /etc/ssl/certs/
COPY --from=builder /orchestrator /orchestrator
EXPOSE 8080 9090
ENTRYPOINT ["/orchestrator"]
The key line is FROM --platform=$BUILDPLATFORM. The builder stage always runs on the native host architecture — amd64 on the development machine. Go compiles natively, cross-targeting arm64 via GOOS/GOARCH. No QEMU. No emulation. No waiting for an emulated arm64 Go toolchain to grind through a codebase.
Build time: thirteen seconds. Including the layer push.
A secondary gotcha: docker buildx build --platform linux/amd64,linux/arm64 (multi-platform) with --platform=$BUILDPLATFORM can share builder output between targets when the host is the same. Both targets end up with the same binary. Just build single-platform — the orchestrator only needs arm64, and the few services that need both can be built as separate pushes. The multi-platform shorthand is convenient for simple cases and a footgun for cross-compilation.
Closing the Loop
The orchestrator could register tasks, reject scope conflicts, and return work to agents. When an agent finished and called /tasks/complete, the orchestrator swapped the label to status:in-review and posted a comment. Then a human reviewed the PR and merged it.
That last step was always going to be the bottleneck. Not because humans are slow, but because at scale, reviewing every agent PR is the same problem as reviewing every developer commit. You need triage. Signal about what requires attention and what can ship on its own.
The signal is already in the labels.
1
2
3
4
5
6
7
8
9
10
11
12
13
14
15
16
func mergeMode(scopes []string, complexity string) string {
    for _, s := range scopes {
        if s == "scope:infra" || s == "scope:networking" {
            return "human" // always — these changes can bring down three regions
        }
    }
    if complexity == "refactor" {
        return "human" // always — too much surface area to auto-merge safely
    }
    for _, s := range scopes {
        if s == "scope:docs" {
            return "immediate" // docs don't break things
        }
    }
    return "ci" // wait for CI, then merge automatically
}
Four cases. scope:infra, scope:networking, and complexity:refactor go to the human queue — no exceptions. scope:docs merges immediately, no CI required. Everything else queues behind CI: the orchestrator calls Forgejo’s merge API with merge_when_checks_succeed: true, and Forgejo fires the merge the moment all checks pass.
The CI gate is what makes automated merging safe at all.
The Smoke Tests
The JupyterLab image build ends with a validation run before the manifest step:
1
2
3
4
5
- name: Run smoke tests
  run: |
    docker run --rm --cap-add SYS_ADMIN \
      ghcr.io/kub0-ai/jupyterlab-claude:arm64-$ \
      bash /smoke-test.sh
Seven checks: the shell is bash (not sh — JupyterLab’s autocomplete depends on it), Podman runs without error, the docker alias resolves, jupyterlab and ipykernel are importable, kubectl is installed, and if a service account token is mounted, the API server is reachable. All seven must pass. One failure and the CI job fails, the manifest step never runs, and merge_when_checks_succeed never fires.
The image that reaches :latest has been proven to start, run Podman, have a working Python environment, and reach the cluster’s API server from inside a container. CI verified this. The human didn’t have to.
The Full Loop
Issue opened → webhook fires → orchestrator registers task → agent polls and claims → branch created, per-agent service account and token issued → agent works, pushes, opens PR → /tasks/complete called → label swaps to status:in-review → orchestrator calls merge API → CI runs smoke tests → Forgejo merges → Flux detects new image tag → HelmRelease reconciles → pod rolls.
Fourteen steps. Zero humans, for the cases where zero humans are appropriate.
The scope:infra issues still land in the review queue. Refactors still need eyes. But a docs fix, a feature addition, a patch to existing behavior — those close themselves. The human remains in the loop for decisions that carry real blast radius. For everything else, the loop runs.
The First Real Run
The theoretical loop is one thing. Watching it happen is another.
The first live end-to-end run: an issue opened in the orchestrator’s own repository asking it to switch PR creation from the admin account to a dedicated bot (kub0ctl). The agent — running inside the prod JupyterLab pod — picked it up on the next 30-second poll. It cloned the repo, read the issue, explored the codebase, wrote the changes across four files, committed, pushed the branch, opened the PR, called /tasks/complete, and resumed polling. The CI gate ran. The PR auto-merged. The orchestrator redeployed with the new code.
Seven minutes thirty-six seconds, start to finish.
The part worth noting: the agent was running inside the pod it was modifying the deployment mechanism of. It claimed a task to improve the system that managed it, submitted the work, and went back to looking for more. It did not notice or care about the recursion.
The kub0ctl change fixed the notification gap — PRs now appear as opened by the bot account, so Forgejo sends a review notification to the actual maintainer. Small improvement, self-delivered.
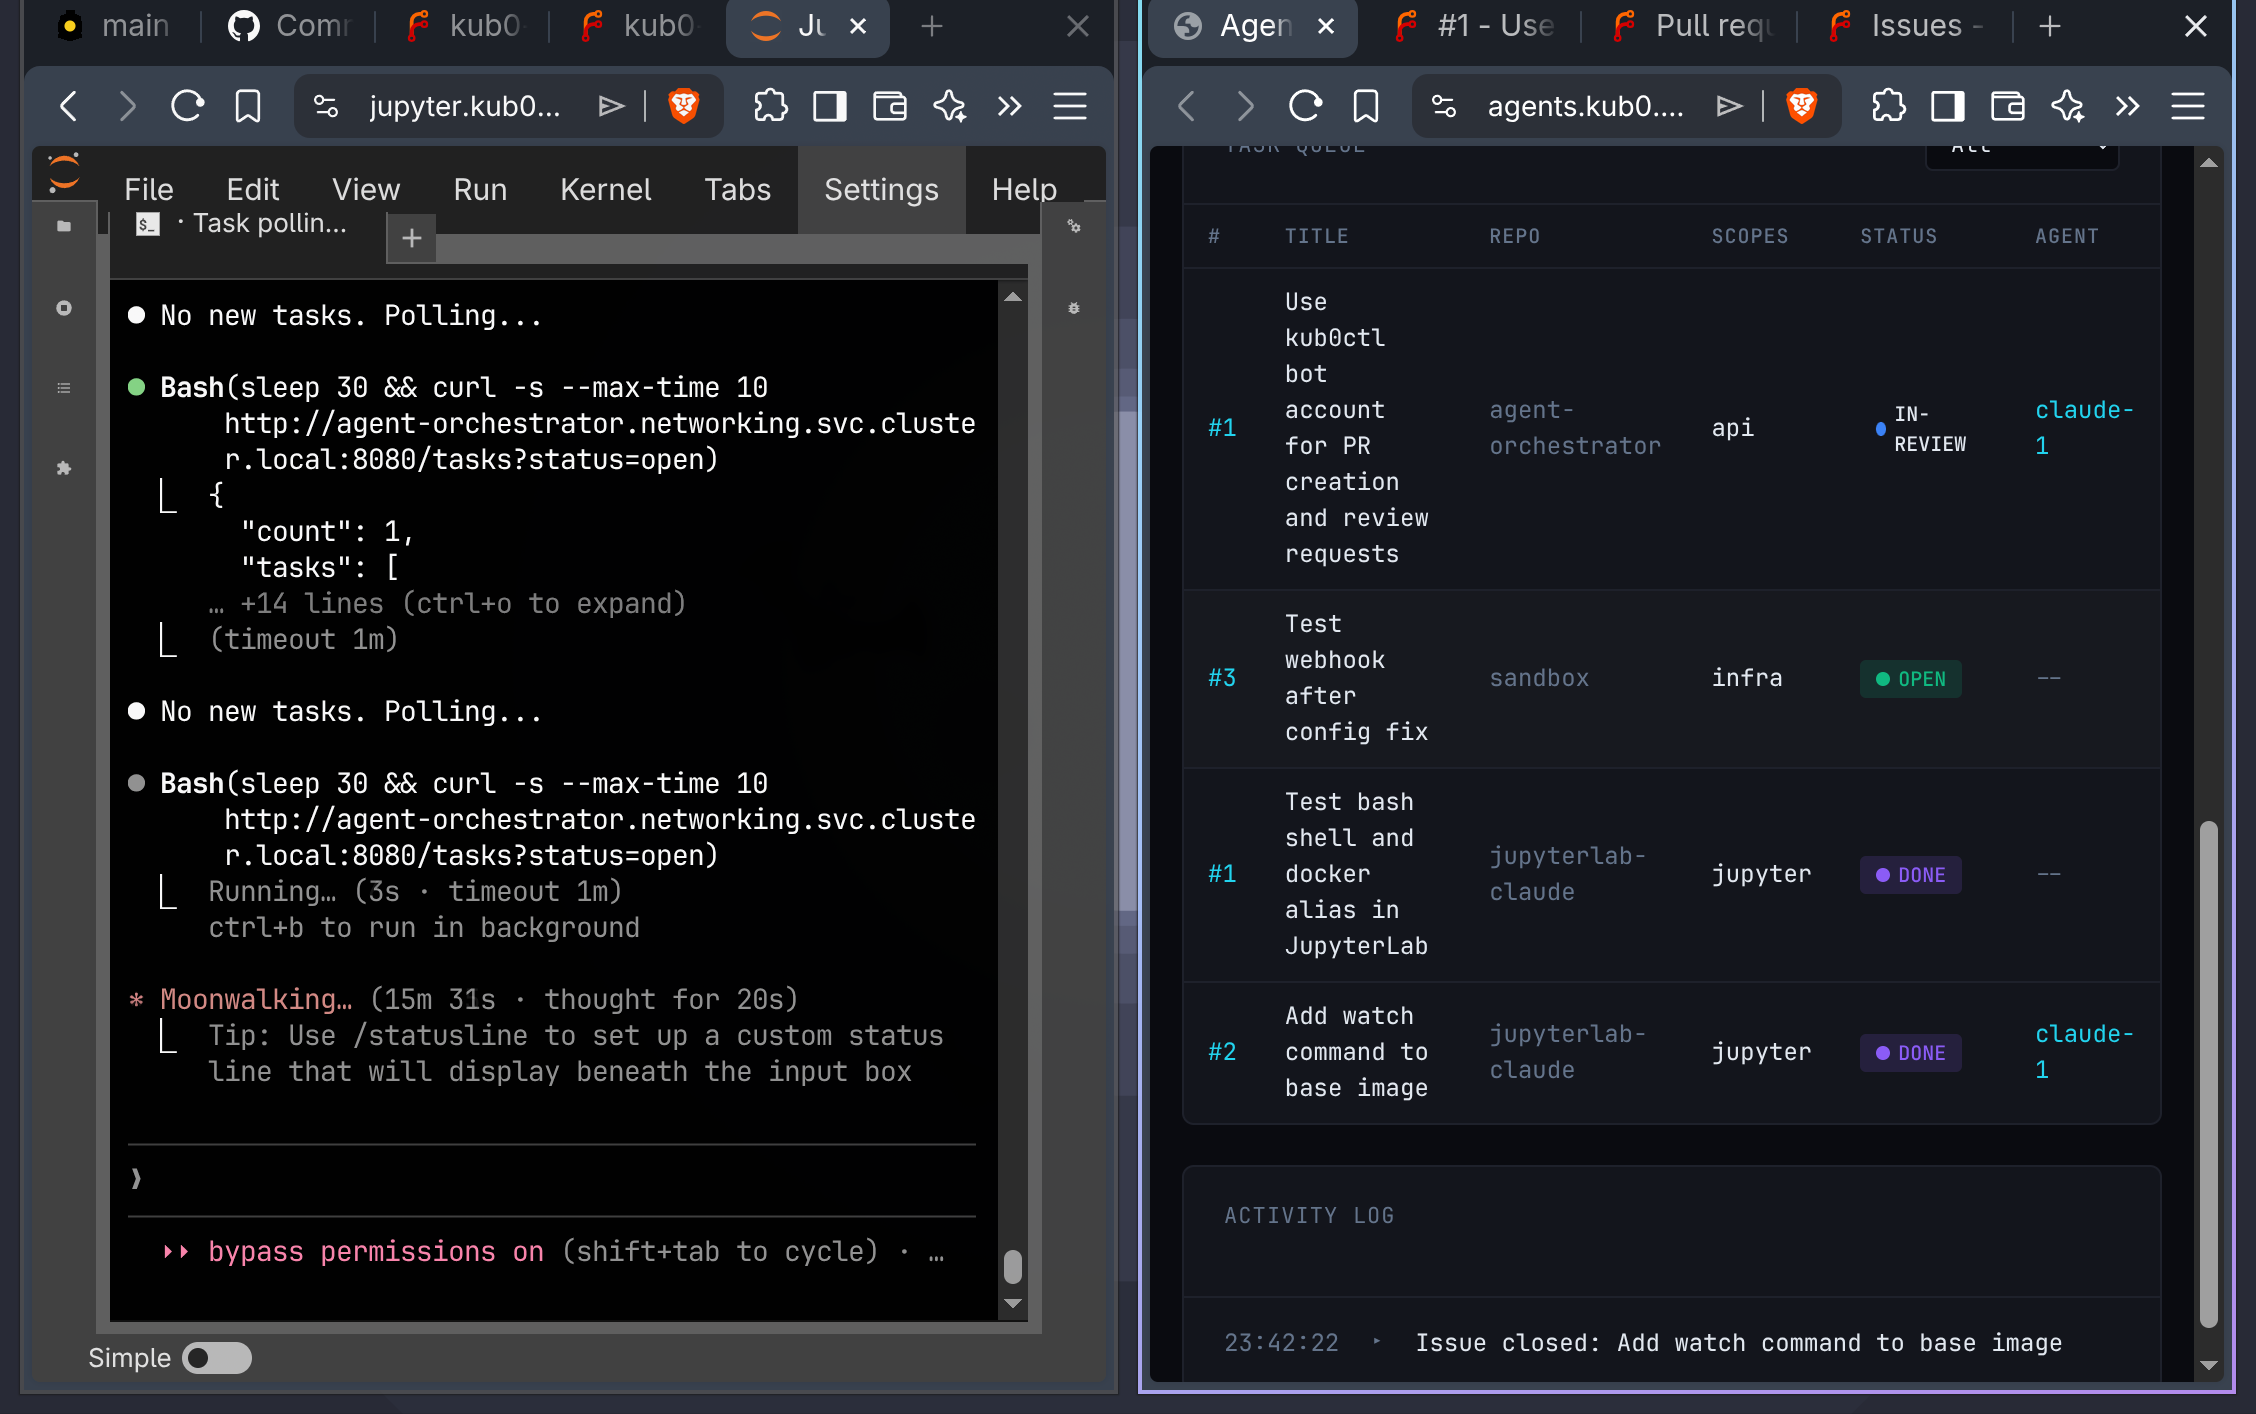 The first working session. Left: the agent bash loop polling
 /tasks?status=open. Right: tasks moving through the queue in real time.
The Intelligence Loop
The mechanical loop was closed. The agents running inside it were still working with partial information.
When an agent claimed a task, it received the issue text and little else. No architectural context beyond the repo’s own CLAUDE.md. No awareness of what other agents were simultaneously active in the same repository. The scope conflict check blocked duplicate claims — but the agent only discovered a conflict when its claim was rejected, not before. And whatever the agent learned during a session — patterns, constraints, edge cases not in the docs — evaporated when the session ended.
That last point had real cost. The first overnight run put two agents to work simultaneously — a threat hunter and a pentester, running autonomous adversarial co-evolution in KubeVirt isolation. They ran through the night. By morning they’d burned through roughly 20% of a weekly Claude Max quota and generated sessions dense with discoveries: YARA patterns, TTP evolutions, endpoint detection signatures, dead ends that saved hours of future investigation. And then the sessions ended. The facts lived in JSONL files that no future agent would ever read.
That’s the problem the intelligence layer was built to solve.
Three additions change this.
The first is domain context injection. The agent-memory repository holds nine domain files — covering networking, storage, services, CCTV, ADS-B, observability, GitOps, and more — maintained across sessions and updated with operational knowledge as it accumulates. At claim time, the orchestrator looks at the task’s scope:* labels and fetches the matching domain files, bundling them into the claim response alongside CLAUDE.md and the repo’s MEMORY.md. An agent claiming a scope:networking task gets the networking domain file: current tunnel configuration, DNS gotchas, Tailscale quirks, Mullvad proxy pool rules — everything that would otherwise require exploratory digging or previous session familiarity. All fetches run concurrently. Missing files warn but don’t fail. The agent starts work with the institutional knowledge of every agent who worked in that scope before it.
The second is a graph.
The orchestrator now builds a live task graph from the queue: every non-done task is a node, every same-repo pair with overlapping scope:* labels gets an edge, every claimed task’s scopes register as locked. Two endpoints:
GET /graph/situation— full snapshot: nodes, edges, scope locks, queue depth by statusGET /graph/conflicts— targeted: locked scopes, open tasks that would conflict with claimed work, blocked tasks with reasons
Both ship in the claim response alongside the task metadata. The agent knows immediately whether its scope territory is contested, and by whom — before starting work, not after a rejected claim.
There’s also a visual layer. GET /graph serves a D3 v7 force-directed dashboard: nodes colored by status (cyan for open, amber for claimed, purple for in-review, red blocked, slate for done), dashed edges for scope overlap, hover tooltips showing claim times and blocked reasons. Queue depth by status in the right sidebar. Scope locks live below that. And at the bottom: a repo registry panel — the admin interface for activating repositories.
The repo registry is where the loop’s operational side lives. When you add a repo via the sidebar input, the orchestrator registers a Forgejo webhook pointing at its own /webhook endpoint, bootstraps all standard labels (status:*, complexity:*) in that repo, and starts tracking it persistently. When you remove a repo, the webhook is deleted and the repo falls silent. Everything the orchestrator knows about what it’s managing is now surfaced in one place, editable from the graph view.
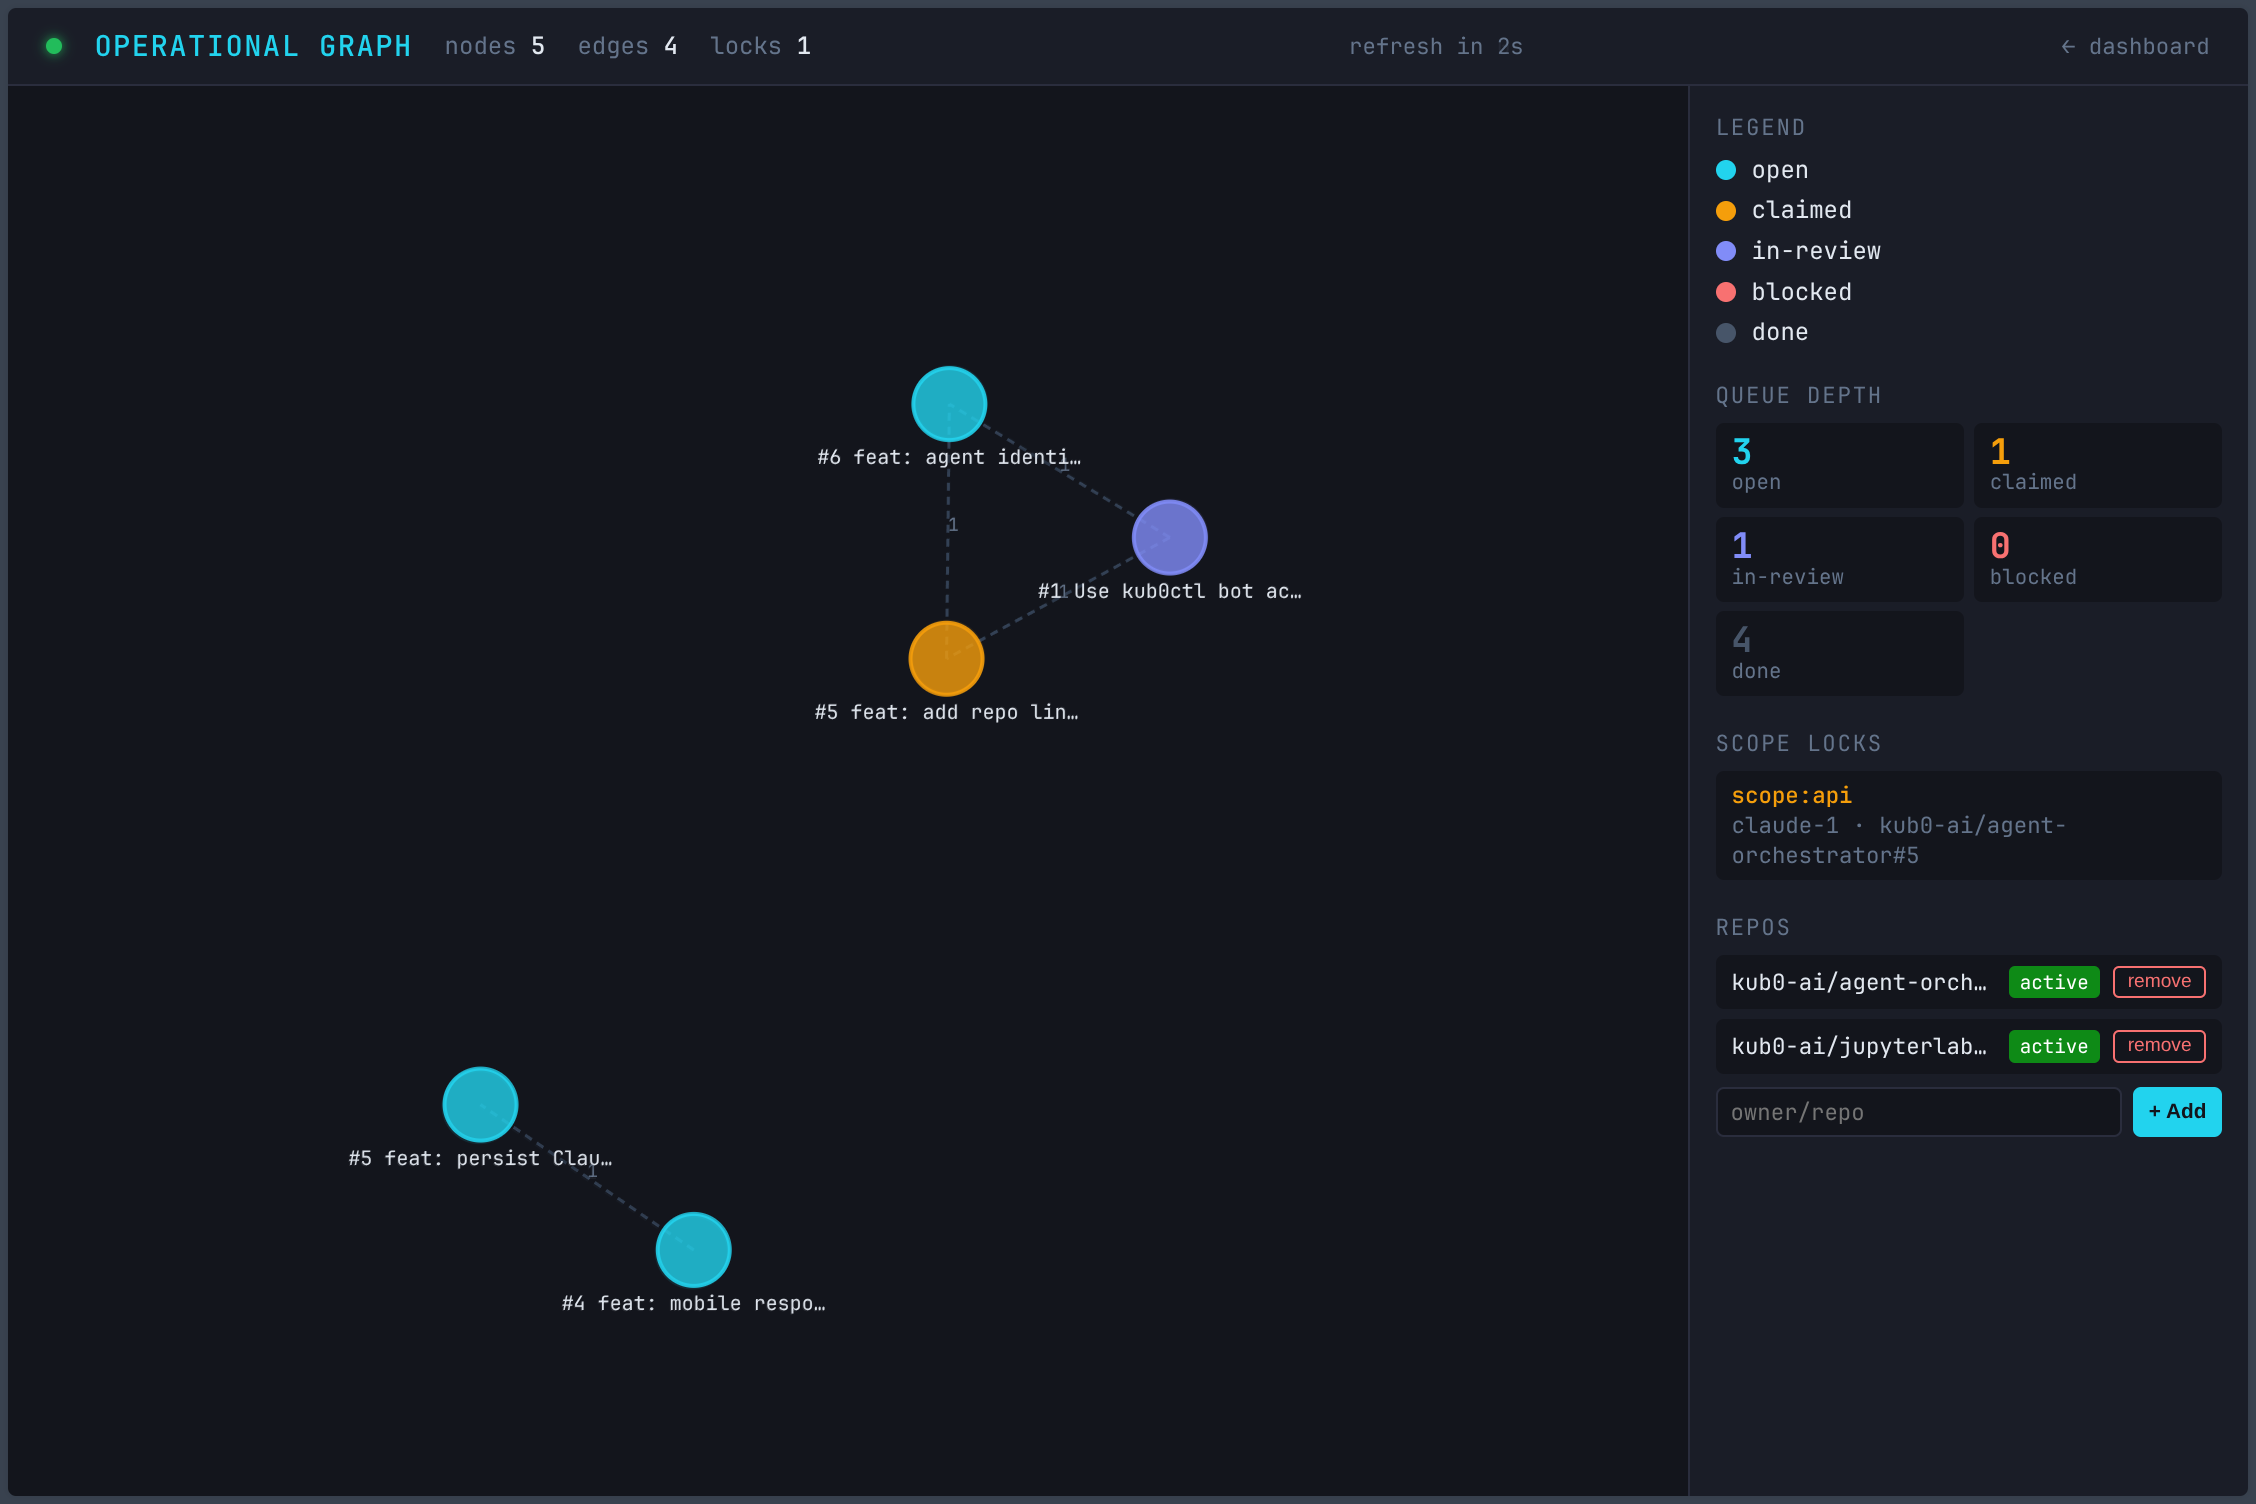 The graph in its early state: 5 nodes, scope:api locked by claude-1 on the agent-identity task. Blocked task in red, dependency edges dashed.
The third addition runs backward.
Every session produces knowledge that dies at its end. An agent discovers an ordering constraint, confirms a pattern, finds an undocumented dependency — and that fact exists nowhere except the session transcript. The next agent working in the same area starts from scratch.
POST /memory/delta gives agents a write path back to the agent-memory repository. A delta is a list of (file, append) pairs targeting domain/*.md files. The orchestrator validates each path, fetches the current blob SHA from Forgejo, appends the text, and commits: memory(delta): agent-id [repo#issue]. The safety gate is simple — only domain/*.md is writable. Common rules and the operational constitution are unreachable.
The knowledge lands in the repository. The next agent clones it at startup. The fact persists.
The four phases of every task now look like this:
- Know the territory — domain files matching the task’s scope arrive at claim time
- See what’s happening — the live conflict graph ships with the same response
- Do the work — the agent operates with full context
- Remember what you learned — discoveries go back to the shared memory via
/memory/delta
The loop compounds. Each completed task enriches the domain files. Each enriched domain file makes the next agent better-informed. The system improves through operation — not through retraining, not through configuration, just through agents doing work and writing down what they find.
The framework managing this loop — session lifecycle, domain file maintenance, memory extraction and injection — is Project Gaius. The dispatcher coordinates task flow. Gaius is what ensures the knowledge survives the session. A deeper look at that system is coming in a follow-up post.
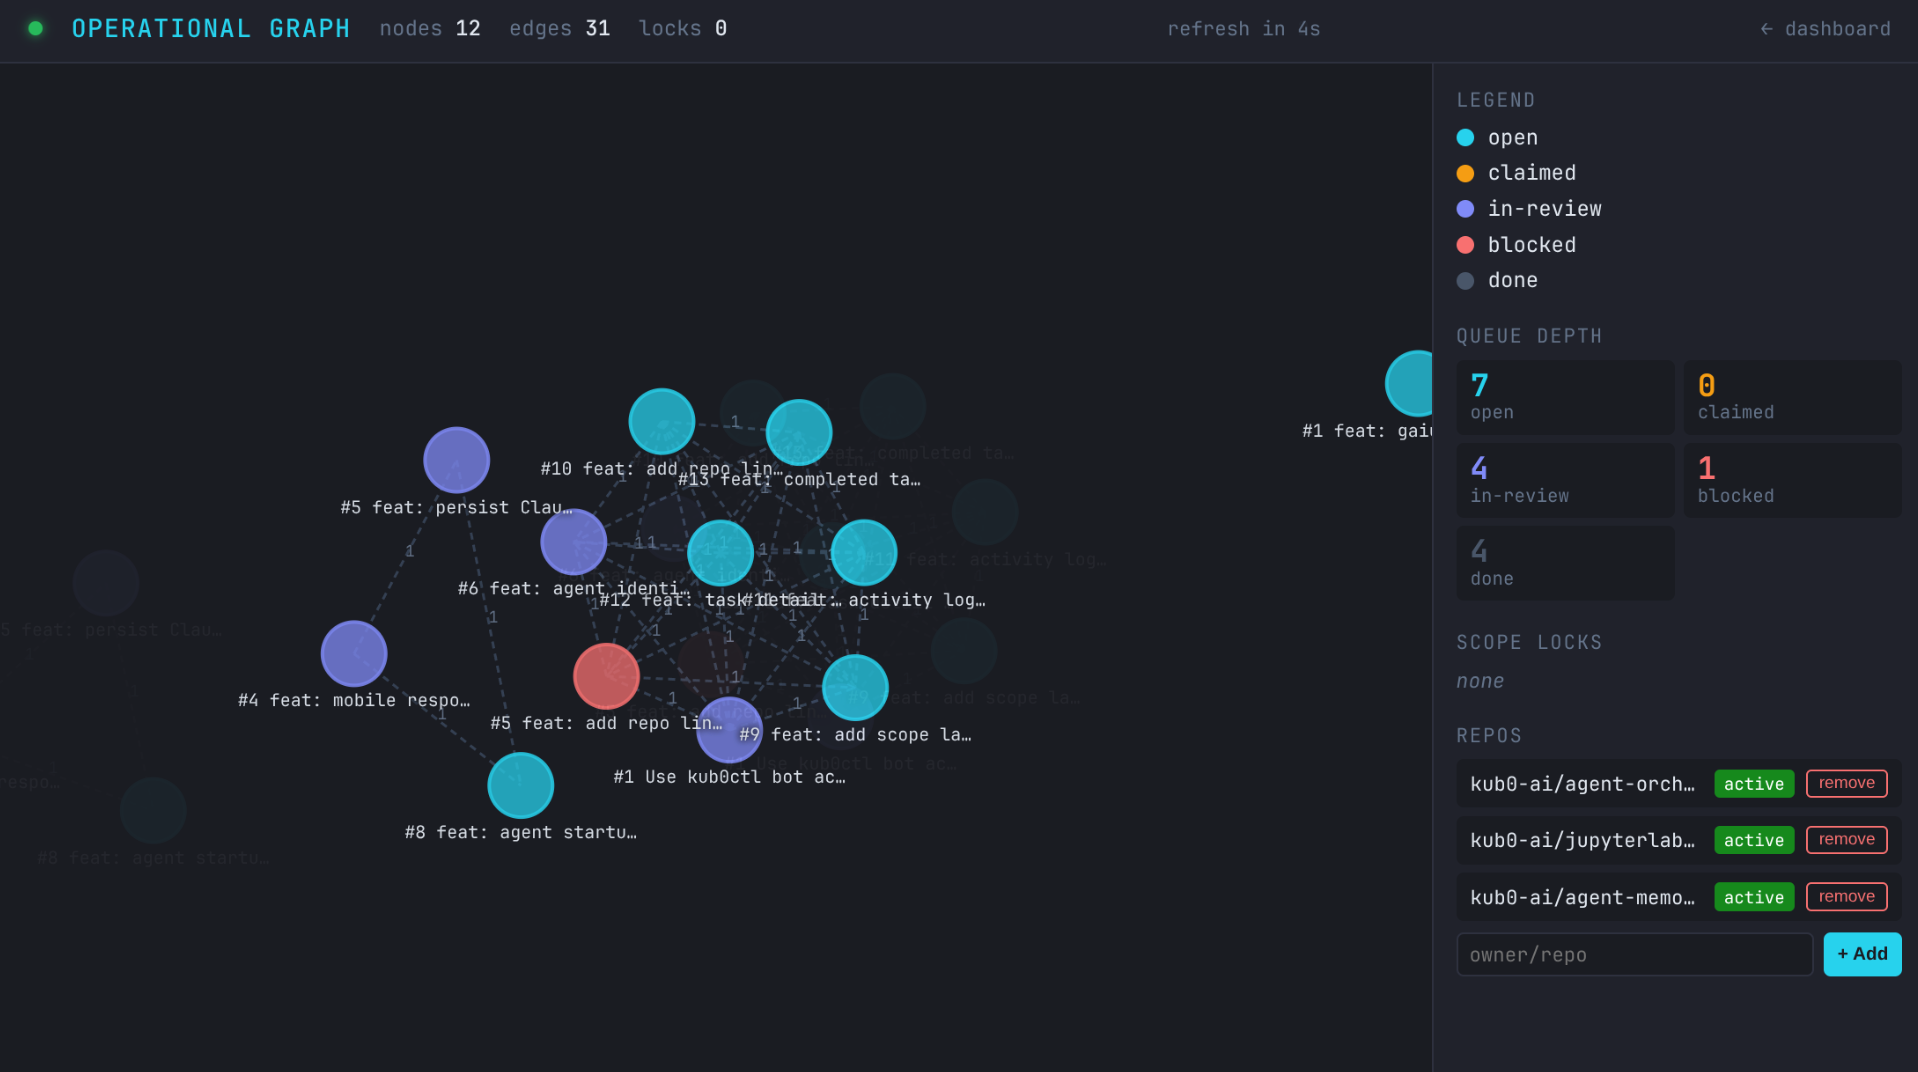
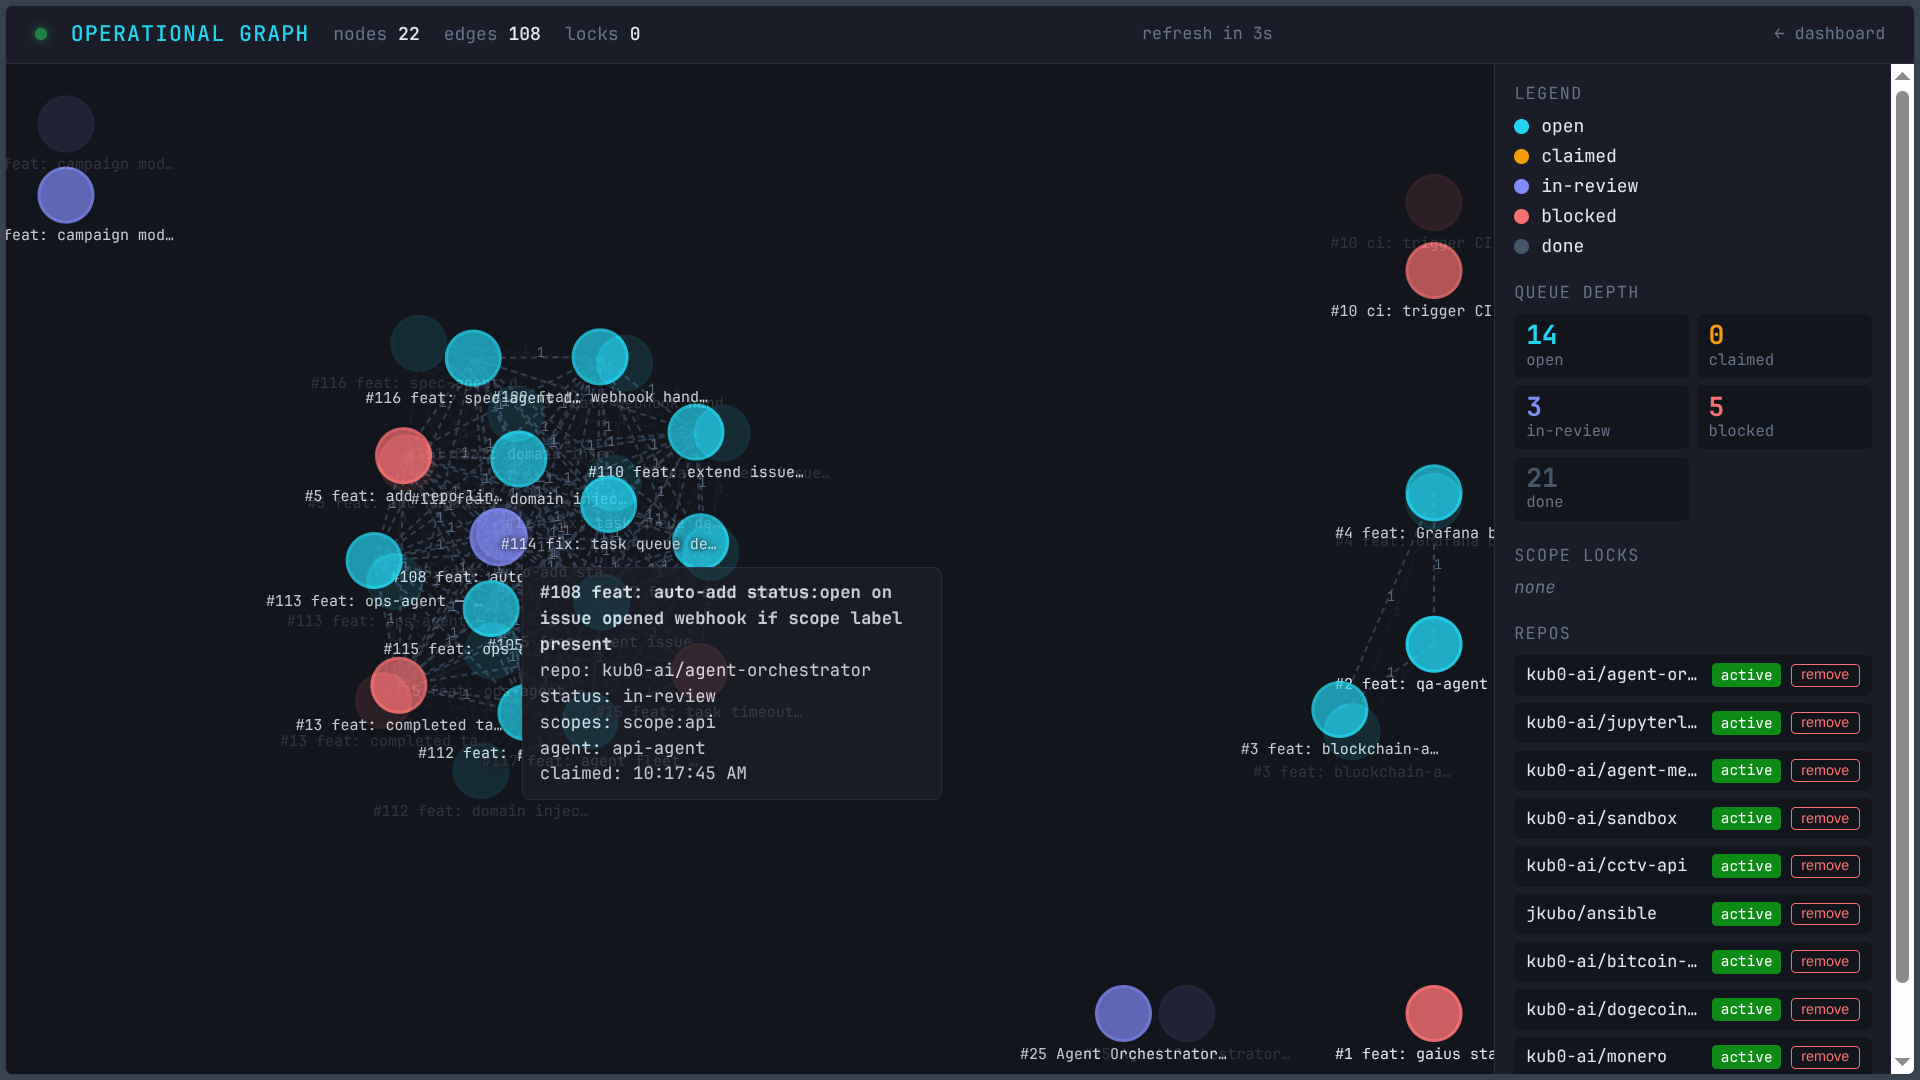 The same graph a day later: 22 nodes, 108 edges, 8 active scope locks across 6 repos. The cluster knows what it’s doing.
Where It Lives
The orchestrator runs as a single-replica Recreate deployment — not RollingUpdate, because there’s one JSON state file and one writer. The PVC is block-sata-single: 1GB on a single DRBD replica, no redundancy needed for state that’s also reflected in Forgejo issues and the agent-memory repository anyway. Secrets: Forgejo admin token, bot token, webhook secret, Cloudflare tokens for the DNS/tunnel layer. All in manifests/agent-orchestrator/.
The dispatcher is online. The loop runs without waiting for a human to push it forward — for the cases where it shouldn’t have to.
One webhook per repo. One issue. Thirty seconds.